
Determining the Break-Even Print Volume for Decentralized Laser De-printing Compared with Traditional Capital Investment
Authored by: Shouryan Mohammed
Mentors: Sophie Nock and Michael Donaldson
Prepared as an analytical research project. All vendor performance statements are labeled as vendor claims; all unobserved operational values are assumptions based on Fermi Estimations
Abstract:
This study asks when an onsite paper de-printing system becomes financially preferable to continuing to purchase single-use copier paper while investing the same capital at an 8 percent opportunity cost. A ten-year discounted-cash-flow model is developed around an Irvine High School baseline of 304,480 printed pages per year, a $23,300 initial cost, $1,000 annual operation and maintenance, a 60 percent eligibility rate for recovery, four uses per eligible sheet, and a paper price of $0.012 per sheet. The technology case is represented by REEP Corporation's circular-print service and laser de-printing concept; its claims of up to ten print cycles and more than 90 percent footprint reduction are treated as vendor assertions rather than independently validated performance.
Under the base case, avoided paper purchases equal approximately $1,644 per year and net annual savings after O&M equal about $644. The ten-year net present value is approximately -$18,977 at an 8 percent discount rate, and simple payback is about 36 years when calculated on gross paper savings before O&M. The modeled break-even volume is approximately 828,000 pages per year, or 2.72 Irvine High equivalents. A centralized district print center therefore appears more plausible than one machine per school. The result is highly sensitive to eligible share, reuse cycles, paper price, annual volume, maintenance, and capital cost. Because no public performance contract, throughput specification, or independently verified school deployment dataset was identified, the study concludes with a measurement-first pilot protocol rather than an unconditional purchase recommendation.
Executive Summary: The economic question is not whether paper reuse is environmentally attractive in principle. The decision question is whether a specific institution prints enough eligible pages, at a high enough avoided paper cost, to recover the capital and operating burden of a de-printing system. The analysis therefore converts an appealing circular-economy idea into an auditable threshold: required annual pages.
At the Irvine High baseline, the system does not recover its opportunity cost. The present value of ten years of net savings is only about $4,323, leaving a negative NPV near $18,977. Break-even requires roughly 828,000 annual pages under the base assumptions. This is equivalent to approximately three Irvine High-sized schools, before adding transportation, sorting labor, storage, quality-control losses, financing friction, or downtime. Those omitted burdens imply that 828,000 pages is best understood as a lower-bound planning threshold rather than a procurement guarantee.
A centralized IUSD scenario is institutionally plausible because the district already operates Publication Services for centralized print jobs. Centralization can pool page volume, standardize paper, locate collection bins, and assign quality control. It also creates costs: routing pages back to the de-printer, protecting confidential records, separating incompatible media, and coordinating school behavior. The recommendation is a staged 60-day print audit followed by a controlled pilot only if verified eligible volume comfortably exceeds the modeled threshold.
Reading Guide: The paper proceeds from the decision context and evidence base to the mathematical model, results, uncertainty analysis, environmental interpretation, governance requirements, and implementation protocol. The Excel workbook supplied with this package is the computational source. Blue input cells are intended for user changes; calculated cells are formula-driven. The presentation and separate executive summary use the same base assumptions and conclusions.
Readers evaluating procurement should focus on Sections 8 through 14. Readers evaluating research design should focus on Sections 5 through 7 and the appendices. Environmental claims are intentionally separated from the financial model because environmental intensity estimates depend on system boundaries, electricity mix, paper manufacturing pathway, end-of-life fate, and the actual number of successful reuse cycles.
Section 1: Introduction
Schools still rely on printed instructional materials, forms, assessments, notices, and administrative records even as digital learning expands. Paper is inexpensive per sheet, but its aggregate cost and environmental burden become material at institutional scale. Conventional recycling recovers fibers after a sheet is discarded. De-printing proposes a different intervention: remove toner while preserving the sheet, then print on it again. In waste-hierarchy terms, this is a reuse strategy rather than ordinary fiber recycling.
The United States Environmental Protection Agency ranks source reduction and reuse above recycling because reuse can prevent the creation of waste and avoid upstream production. That policy logic supports investigation, but it does not prove that a particular machine is financially attractive. Capital equipment must be evaluated against alternative uses of funds, annual maintenance, uncertain utilization, operational labor, and technology risk.
This paper frames the problem as engineering economics. The central output is not a universal yes-or-no answer. It is a break-even surface showing how required print volume changes with cost, paper price, eligibility, reuse cycles, and discount rate. Irvine High provides a concrete baseline; Irvine Unified Publication Services provides a plausible shared-use setting.
Section 2: Background (Paper, Reuse, and De-inking)
Traditional paper recycling mixes recovered paper with water and processing chemicals, separates fibers, removes contaminants, and remanufactures pulp. Fiber quality declines through repeated recycling because fibers shorten. Direct sheet reuse attempts to preserve more of the embodied value by avoiding repulping between print events. The distinction matters: a sheet that is successfully de-printed and reused displaces a new sheet immediately, while a sheet collected for recycling becomes an input to a broader commodity system.
Laser de-printing applies energy to detach or disrupt printed toner. Commercial feasibility depends on toner chemistry, paper coating, thermal damage, residual image quality, machine speed, and repeatability. REEP states that its system works with legacy office printers and inks, can allow up to ten uses, and is offered through a circular-print service with centralized de-printers and reusable paper. These are relevant design signals, but procurement decisions require contract-level verification.
Operational compatibility is as important as laboratory removal. Schools use colored stock, labels, confidential documents, stapled packets, handwritten sheets, crumpled pages, and mixed print technologies. Only a fraction of total pages may be eligible. The model therefore contains an explicit eligibility parameter rather than assuming every printed page returns for reuse.
Section 3: Circular Economy Framework
Circular-economy analysis asks how products and materials can retain value through repeated use. In this case the functional unit is one delivered printed page. The linear system purchases a new sheet for each page and then recycles or discards it. The circular system buys or receives reusable stock, prints it, collects eligible output, removes toner, verifies quality, and returns the sheet to inventory.
The loop is only circular when return logistics actually operate. A theoretical capacity of ten uses does not mean the average sheet will complete ten cycles. Loss, contamination, user retention, handwriting, edge damage, mis-sorting, and quality rejection all reduce realized uses. This study uses four average uses in the base case and tests alternatives. The avoided-sheet fraction for an eligible page is 1 - 1/u, where u is average total uses.
The framework also separates financial and environmental additionality. Avoided purchases may save money, but a service fee can transfer rather than eliminate cost. Environmental benefits may occur even when the NPV is negative. A district can therefore make a policy choice to pay for environmental outcomes, but it should report that choice transparently rather than describe it as financially self-funding.
Section 4: Technology and Vendor-Claim Boundary
REEP describes a laser-based system that removes ink from copier paper and offers the capability as a service. The company reports up to ten print and re-print cycles, centralized de-printers sized to organizational volume, and lifecycle cost and emissions reductions. Those statements establish the intended operating model. They do not substitute for third-party acceptance testing in a school environment.
The study therefore applies an evidence hierarchy. Government sources support the waste-management hierarchy and public institutional facts. Peer-reviewed literature supports the conceptual environmental value of cutting stages from the office-paper lifecycle. District and state sources support the case context. Vendor pages describe product functionality. Cost values and the estimated print baseline are labeled project assumptions.
Before procurement, a request for information should require verified throughput, energy consumption, compatible paper and toner lists, sheet-quality thresholds, actual average reuse cycles, jam rates, service response times, consumables, warranties, data-security procedures, end-of-life obligations, and total delivered price. The financial workbook exposes these variables so a future quotation can replace placeholders without rebuilding the model.
Section 5: Literature Review
Research on office-paper systems consistently emphasizes lifecycle boundaries. Counsell and Allwood argued that un-printing can remove more lifecycle stages than conventional fiber recycling and may therefore offer large climate benefits, while acknowledging uncertainty about the share of paper suitable for un-printing. That uncertainty maps directly to this study's eligibility parameter.
Lifecycle assessments of printing and writing paper show that paper production is a major contributor to several impact categories. A North American summary for a ream of office paper reported 4.25 kg CO2-equivalent across the assessed lifecycle, with uncoated freesheet production the largest contributor to global warming. The estimate is useful for scenario analysis but should not be treated as a universal constant for every paper supplier or electricity grid.
Studies of onsite paper-making and innovative recycling technologies show that utilization rate is decisive: capital and operational burdens are spread over more output as volume rises. This finding reinforces the engineering-economic focus on throughput. The literature also warns that water, energy, chemical use, collection, transport, and drying can change the relative performance of recycling pathways.
A gap remains between technology demonstrations and public-school procurement decisions. Published vendor materials do not provide all parameters needed to validate a district business case, while public school data rarely report page-level flows, compatibility, and return rates. This study contributes an auditable decision model and a data-collection protocol designed to close that gap.
Section 6: Research Questions & Hypothesis
Primary research question: Under what operating conditions does decentralized or shared laser de-printing become more cost-effective over ten years than continuing to purchase new paper while investing the same capital at an 8 percent opportunity cost?
Secondary questions examine the minimum annual print volume, the number of Irvine High equivalents required, the maximum justifiable purchase price, the effect of paper-price inflation, the importance of average reuse cycles, the relative promise of a district print center, and the magnitude of environmental benefits under transparent lifecycle assumptions.
Hypothesis 1 (H1) predicts that a dedicated machine for one average high school will have a negative NPV under the approved assumptions. Hypothesis 2 (H2) predicts that pooling volume across schools can cross the break-even threshold. Hypothesis 3 (H3) predicts that volume, eligibility, paper price, capital cost, and O&M will dominate the sensitivity results. Hypothesis 4 (H4) predicts that environmental benefits can be positive even in financially unfavorable cases.
Section 7: Methodology & Scope
The analysis uses a deterministic discounted-cash-flow model, scenario analysis, one-way sensitivity analysis, and a reproducible 10,000-trial Monte Carlo simulation. The analysis horizon is ten years. The base discount rate is 8 percent, representing the opportunity-cost benchmark rather than a forecast of a guaranteed S&P 500 return.
The system boundary begins with the capital or service commitment and includes annual Operations & Maintenance (O&M) and avoided purchases of copier paper. It excludes labor, space, collection containers, internal transport, electricity, financing fees, taxes, residual value, and downtime unless the user enters them as additional annual cost. Exclusion makes the base break-even threshold optimistic.
The Irvine High page estimate scales an earlier 320,000-page assumption for a 2,000-student school to the California Department of Education's reported enrollment of 1,903 students, producing 304,480 pages. It is not an observed PaperCut total. The district scenario is a scalable multiple rather than a claim about IUSD's actual annual pages.
Section 8: Mathematical Model
Let V denote annual printed pages, e the eligible share, u the average total uses per eligible sheet, p the price of a new sheet, M annual O&M, C initial capital cost, r the discount rate, and n the horizon. Avoided annual sheets are A = V e (1 - 1/u). Gross annual paper savings are G = A p. Net annual savings are B = G - M - L, where L represents any additional annual logistics or energy cost.
For constant annual net savings, NPV = -C + B[(1 - (1+r)^(-n))/r]. The annuity factor at 8 percent for ten years is approximately 6.7101. Equivalent annual value is NPV divided by that factor. The break-even volume solves NPV = 0: V* = [M + L + C/AF] / [e(1 - 1/u)p].
The benefit-cost ratio is the present value of gross avoided paper purchases divided by the present value of O&M plus capital. Simple payback is C/G when gross savings are used, or C/B when net savings are positive. IRR is the discount rate that makes NPV zero; when annual net savings are too small relative to capital, the economically meaningful result may be negative or outside conventional reporting bounds.
Detailed calculation results are provided on the Financial Model Spreadsheet linked here:
Google Sheets Version: https://docs.google.com/spreadsheets/d/1aJZFgD1XxT7v0-4FTUgr-CC0sfWxzzQG5GKI96KQAOM/edit?usp=sharing
Excel Version: https://drive.google.com/file/d/1aaZBmOwZb8rq2alVpq8hAFvoK4aZL1X1/view?usp=sharing
Section 9: Irvine High Baseline Results
At 304,480 pages, 60 percent eligibility, and four uses, the circular loop avoids 137,016 new sheets per year. At $0.012 per sheet, gross annual savings are approximately $1,644. After $1,000 annual O&M, net annual savings are approximately $644.
Discounting that ten-year annuity at 8 percent gives a present value near $4,323. Subtracting the $23,300 initial cost yields an NPV near -$18,977. The benefit-cost ratio is approximately 0.48 when gross avoided-paper benefits are compared with capital plus the present value of O&M. The project therefore does not meet the financial decision rule for a single baseline school.
The result does not show that reuse lacks value. It shows that low per-sheet paper cost makes capital recovery difficult. A few cents of avoided cost per page can justify equipment only at sufficient scale or when additional benefits - secure document destruction, avoided shredding fees, carbon objectives, resilience, or educational value - are monetized and verified.
Section 10: District Print-Center Scenario
Irvine Unified operates Publication Services, a centralized print shop serving schools, departments, and affiliated groups. That existing organizational capability makes a shared circular-print pilot more plausible than a hypothetical machine placed at every school. A print center can aggregate volume, standardize media, train a small team, and monitor quality.
At three Irvine High equivalents, modeled annual volume is 913,440 pages. Gross paper savings rise to about $4,933 and net savings to about $3,933. Ten-year NPV becomes positive at roughly $3,092 under the base assumptions. Five equivalents produce about 1.52 million pages and a substantially larger margin. These values exclude collection logistics and must therefore be stress-tested.
Centralization introduces reverse logistics. Schools must separate eligible paper, protect confidential information, avoid staples and handwriting, and move sheets to and from the print center. A hub-and-spoke design can succeed only if these costs are lower than the additional margin above break-even. A procurement case should therefore require verified eligible pages at least 20 to 30 percent above the calculated threshold.
Section 11: Break-even Analysis
The base break-even threshold is about 828,000 pages per year. Dividing by 304,480 yields 2.72 Irvine High equivalents. Because institutions cannot deploy 0.72 of a school, a practical interpretation is that at least three similar schools would need to contribute eligible volume under idealized assumptions.
The threshold rises sharply when eligibility falls or logistics costs are included. At 40 percent eligibility, required volume exceeds 1.24 million pages. At two average uses, fewer sheets are displaced per eligible page and the threshold increases. Higher paper prices reduce the threshold; lower prices increase it. The workbook provides a two-variable sensitivity matrix so users can observe these interactions.
A procurement decision should not target exact model break-even. Forecast error, downtime, learning effects, and behavioral losses make a safety margin necessary. This paper recommends a verified-volume hurdle of at least 1.0 million eligible-compatible pages per year for the base commercial structure, followed by contract-specific recalculation.
Section 12: Engineering-Economics Measures
Net Present Value (NPV) is the primary decision metric because it discounts future savings and compares them directly with the upfront cost. Equivalent annual value converts NPV to a level annual amount, which is useful when comparing options with different lives. The benefit-cost ratio communicates scale but can change depending on whether O&M is netted from benefits or treated as cost; the workbook uses the latter convention.
Simple payback is intuitive but ignores discounting and cash flows after payback. IRR can be misleading when cash flows are unconventional and provides little additional insight when the base case is strongly negative. The opportunity-cost comparison is already embedded in the 8 percent discount rate: investing the capital and purchasing paper is the counterfactual against which avoided future costs are discounted.
The model assumes no residual value after ten years. A guaranteed resale or contractual buyback value would improve NPV. Conversely, shorter useful life, major replacement parts, financing charges, or escalating service fees would reduce NPV. These items should be entered once a vendor proposal exists.
Section 13: Sensitivity Analysis
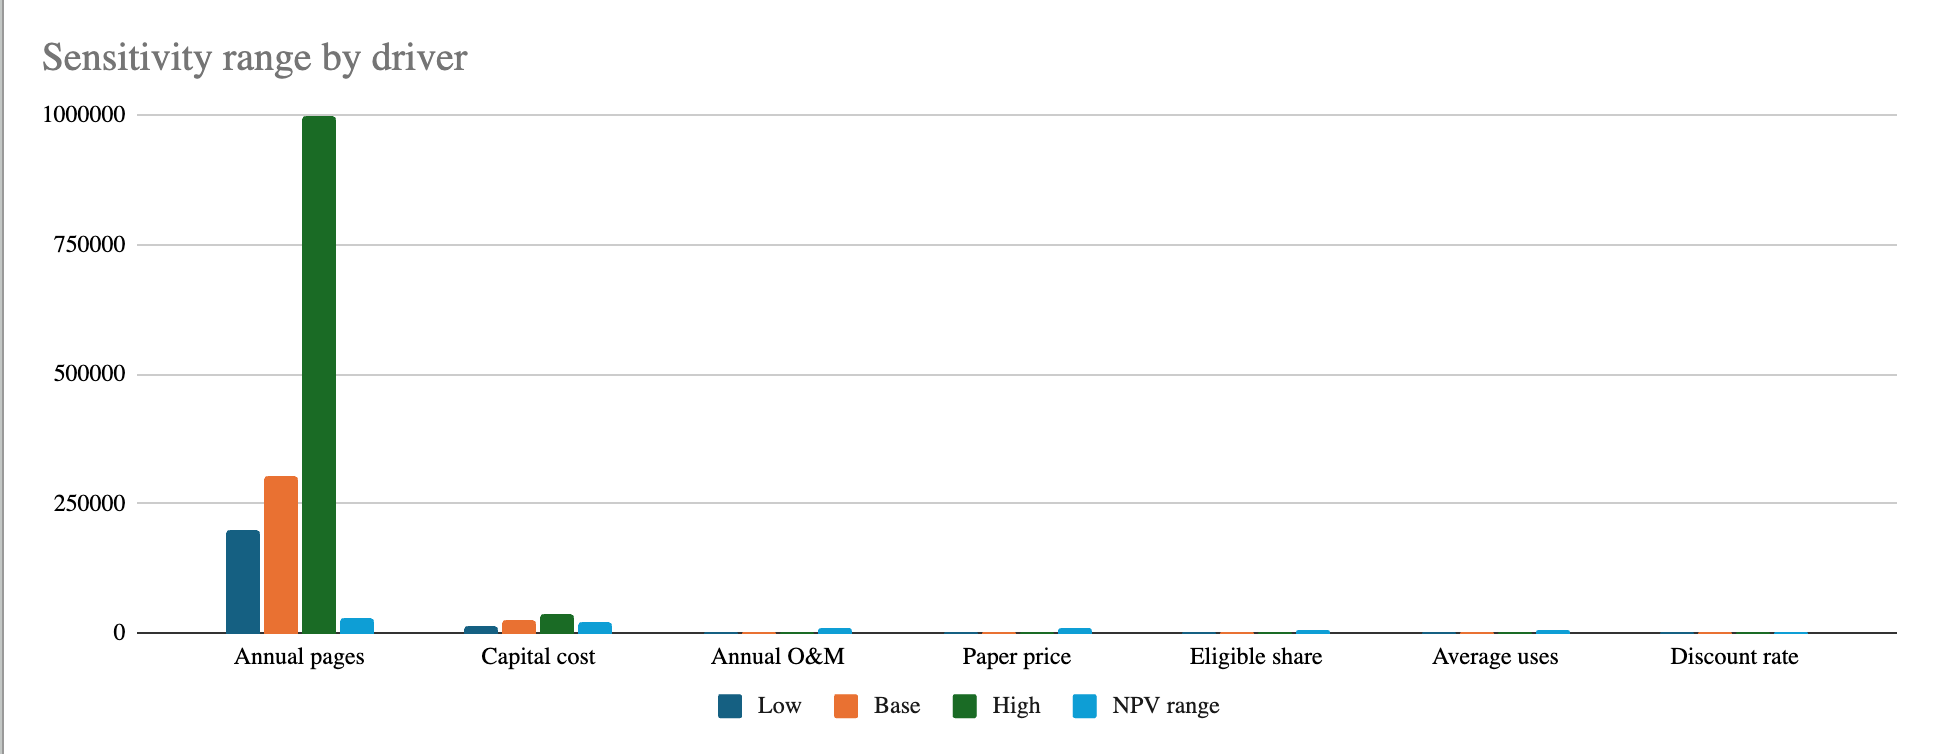
One-way sensitivity varies one assumption while holding the others constant. Annual page volume and capital cost have large, nearly linear effects. Paper price and eligibility also matter because they determine avoided purchases. Average uses has diminishing returns: moving from two to three uses avoids a larger additional fraction than moving from nine to ten.
O&M has a direct annual effect multiplied by the annuity factor. A $500 increase in annual O&M reduces ten-year NPV by about $3,355 at 8 percent. The discount rate matters, but it does not rescue the baseline because the project is far from break-even. Paper-price inflation can improve later savings; its effect should be modeled with a real-versus-nominal consistency check.
The decision is therefore utilization-driven. Administrators have more leverage by aggregating verified compatible pages than by fine-tuning the discount rate. Negotiating a service structure that shifts capital and performance risk to the vendor may also change the decision more than small variations in finance assumptions.
Section 14: Monte Carlo Simulation
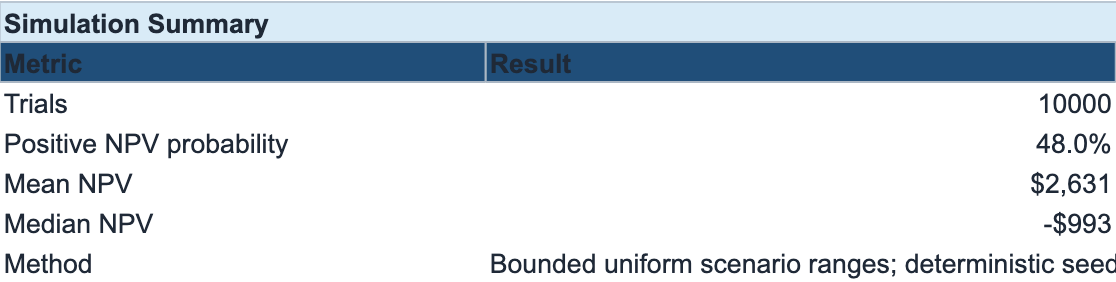
The workbook includes 10,000 reproducible simulation trials. Annual pages, eligibility, paper price, O&M, capital cost, average uses, and discount rate are sampled from bounded distributions centered on the base case. The simulation is a scenario generator, not a forecast; its probability result is conditional on the chosen distributions.
For a single-school case, most trials remain negative because typical avoided paper spending is small relative to the initial cost. Positive outcomes occur in the high-volume, high-paper-price, high-eligibility, low-cost tail. For district-scale cases, the probability of positive NPV rises markedly as aggregated volume moves above the threshold.
Decision-makers should update distribution bounds using a print audit and a binding quotation. The value of the simulation is not the appearance of precision from 10,000 trials. Its value is showing how uncertainty compounds and identifying which measurements are worth collecting before capital is committed.
Section 15: Environmental Analysis
Environmental benefits are estimated from avoided new sheets, not from total printed pages. Using a North American lifecycle estimate of 4.25 kg CO2-equivalent per 500-sheet ream, the base case's 137,016 avoided sheets correspond to roughly 1.16 metric tons CO2-equivalent per year before accounting for de-printer electricity, reusable-paper production, transport, and end-of-life differences.
EPA's historical paper-recycling guidance reports substantial energy, water, landfill, and greenhouse-gas benefits per ton recycled, but direct sheet reuse is not identical to recycling a ton of mixed paper. Water and tree equivalents are therefore presented as optional scenario indicators, not certified impacts. A defensible environmental report would use a vendor-specific, third-party lifecycle assessment and measured electricity consumption.
The environmental case can remain favorable when the financial case is negative. If a district has an internal carbon price, waste-reduction mandate, or educational objective, it can add a transparent shadow value per avoided sheet or per ton CO2-equivalent. That extension should be reported separately from cash savings.
Section 16: Operational and Governance Requirements
A circular print system changes workflow. Collection bins need clear eligibility rules. Confidential documents require approved chain-of-custody and verified image removal. Staff must know whether handwritten, stapled, folded, or damaged sheets are excluded. Inventory must distinguish reusable stock from ordinary paper.
Governance should assign ownership for print analytics, physical collection, quality acceptance, cybersecurity, maintenance response, and environmental reporting. A small steering group can include Publication Services, information technology, facilities, procurement, risk management, teachers, and student sustainability representatives.
Key performance indicators should include total pages, eligible share, return rate, successful de-print rate, average completed cycles, jam and rejection rates, energy per processed sheet, labor minutes per thousand sheets, avoided purchases, unit cost, uptime, and user satisfaction. Without these measures, apparent circularity can mask low utilization.
Section 17: Decision Framework
The recommended framework begins with measurement. If verified annual compatible volume is below 500,000 pages, a capital purchase should not proceed under the base economics. Between 500,000 and roughly 1 million pages, a shared or vendor-financed pilot may be considered, but the district should require unusually favorable pricing or additional monetized benefits. Above 1 million pages, a district print center warrants a formal quotation and pilot.
Volume alone is not sufficient. A second gate requires eligibility and return performance. A third gate requires contract economics, including energy, labor, consumables, service, and end-of-life obligations. A fourth gate requires document-security and quality acceptance. Only after all four gates pass should the district compare final NPV with other capital priorities.
The framework avoids advocacy. It allows the same evidence to support rejection, pilot, shared deployment, or full adoption depending on local conditions.
Section 18: Limitations
The most important limitation is data quality. The Irvine High page count is fermi estimated, not observed. Capital and O&M costs are approximations of 2026 REEP pricing on average, not a current binding REEP quotation. Average reuse cycles, eligibility, throughput, energy consumption, and labor are not independently measured in a California public-school deployment.
The model treats annual volume as stable and initially omits inflation, taxes, financing, salvage value, downtime, space, and collection labor. It uses an 8 percent opportunity-cost rate for scenario comparison, not as a promise of market returns. Environmental factors use secondary sources whose system boundaries differ from the proposed system.
The paper should therefore be interpreted as a screening study and measurement plan. Its calculations are transparent enough to update, but its procurement conclusion must remain conditional until primary data replace assumptions.
Section 19: Future Research
Future work should begin with twelve months of PaperCut or copier-counter exports by location, device, paper size, simplex/duplex status, and job type. A manual waste-sort study should estimate the fraction of pages that are clean, compatible, recoverable, and non-confidential. Interviews should quantify staff labor and workflow constraints.
A pilot should randomly sample output over time, track individual sheets or batches, and measure the distribution of completed reuse cycles rather than only the maximum. Blind quality assessment can compare readability, curl, whiteness, show-through, printer jams, and user acceptance against new paper.
A third-party lifecycle study should measure electricity, consumables, reusable-paper production, transport, avoided new-paper production, and end-of-life treatment. Financial research should compare purchase, lease, click-charge, shared-service, and performance-contract structures.
Section 20: Conclusion
The analysis supports the primary hypothesis: one REEP-like de-printing system dedicated to an Irvine High-sized school is unlikely to outperform the approved financial counterfactual on paper savings alone. The base case produces an NPV near -$18,977 and requires about 828,000 annual pages to break even.
The district-scale hypothesis is plausible. Three Irvine High equivalents cross the idealized threshold, and IUSD's existing Publication Services operation provides a logical site for further evaluation. Yet the margin is sensitive to logistics, labor, eligibility, service terms, and actual reuse performance.
The defensible recommendation is not immediate purchase. It is a staged evidence program: measure print volume, obtain a binding total-cost proposal, test sheet recovery and quality, quantify security and labor, update the workbook, and proceed only when verified volume exceeds break-even with a prudent safety margin. That conclusion aligns circular-economy ambition with fiscal responsibility.
References
California Department of Education. (2026). School profile: Irvine High. https://www.cde.ca.gov/sdprofile/details.aspx?cds=30736503030152
Counsell, T. A. M., & Allwood, J. M. (2007). Reducing climate change gas emissions by cutting out stages in the life cycle of office paper. Resources, Conservation and Recycling, 49(4), 340-352. https://doi.org/10.1016/j.resconrec.2006.03.018
Irvine Unified School District. (n.d.). Publication Services. https://iusd.org/business-services/publication-services
REEP Corporation. (n.d.). Net zero circular printing for our future. https://www.reepcorp.com/
REEP Corporation. (n.d.). Circular Print Service. https://www.reepcorp.com/services-3
Two Sides North America. (2018). Printing & writing papers: Life-cycle assessment summary report. https://twosidesna.org/wp-content/uploads/sites/16/2018/05/Printing_and_Writing_Papers_-_Life-Cycle_Assessment_Summary_Report.pdf
U.S. Environmental Protection Agency. (2026). Recycling basics and benefits. https://www.epa.gov/recycle/recycling-basics-and-benefits
U.S. Environmental Protection Agency. (2025). Sustainable materials management: Non-hazardous materials and waste management hierarchy. https://www.epa.gov/smm/sustainable-materials-management-non-hazardous-materials-and-waste-management-hierarchy
U.S. Environmental Protection Agency. (archived). Frequent questions: Paper recycling. https://archive.epa.gov/wastes/conserve/materials/paper/web/html/faqs.html
U.S. Environmental Protection Agency. (archived). Basic information details: Paper recycling. https://archive.epa.gov/wastes/conserve/materials/paper/web/html/index-2.html
Yamaguchi, K., et al. (2020). Environmental assessment of innovative paper recycling technology using product lifecycle perspectives. Resources, 9(3), 23. https://doi.org/10.3390/resources9030023
Appendix A. Formula Reference
Avoided sheets = Annual pages x Eligible share x (1 - 1 / Average uses).
Gross annual savings = Avoided sheets x Paper price per sheet.
Net annual savings = Gross annual savings - O&M - Additional annual cost.
Annuity factor = [1 - (1 + discount rate)^(-years)] / discount rate.
NPV = -Capital cost + Net annual savings x Annuity factor.
Break-even annual pages = [O&M + Additional annual cost + Capital cost / Annuity factor] / [Eligible share x (1 - 1 / Average uses) x Paper price].
Appendix B. Pilot Data Dictionary
Required fields include site, device, date, job type, page size, simplex/duplex, toner type, printed pages, collected pages, eligible pages, rejected pages by reason, successfully de-printed pages, completed reuse cycle, processing time, energy, jam count, quality result, security classification, and disposition.
Each field should have a named owner, measurement method, unit, allowed values, and validation rule. Batch identifiers should allow repeated-cycle tracking without storing document content. Personally identifiable or confidential information should never be copied into the research dataset.
Appendix C. Procurement Questions
- What is the total delivered price under purchase, lease, and click-charge options?
- What compatible paper, toner, printer, and media specifications are guaranteed?
- What throughput, uptime, successful de-print rate, and average completed cycles are warranted?
- What consumables, electricity, operator labor, training, support, and replacement parts are required?
- How is confidential information verified as removed, and what audit evidence is available?
- Is a third-party lifecycle assessment available with disclosed boundaries and assumptions?
- What happens to rejected sheets and equipment at end of life?
- Can payment be tied to verified avoided-sheet or uptime performance?
Appendix D. Reproducibility and Use
The companion workbook contains the full input set, ten-year cash flows, scale scenarios, break-even calculations, sensitivity grids, Monte Carlo trials, environmental indicators, a dashboard, and source notes. Users should replace blue assumptions with measured or contracted values and review all outputs before relying on them.
This report is an educational engineering-economics analysis, not investment advice, a vendor endorsement, or a certified lifecycle assessment. Market returns are uncertain; the 8 percent rate is a scenario assumption.
Link to referenced workbook (graphs show properly after download or opening with google sheets): https://drive.google.com/file/d/1aaZBmOwZb8rq2alVpq8hAFvoK4aZL1X1/view?usp=sharing
Appendix E. Illustrative Sensitivity Cases
The following cases hold the ten-year horizon and 8 percent discount rate constant. They are screening scenarios, not forecasts. Each case should be recalculated with measured volume and a binding vendor proposal.
Interpretation: the project moves toward viability when compatible volume, eligibility, completed cycles, or avoided paper cost rises, and away from viability when capital, O&M, logistics, or discounting rises. Because several favorable variables may be correlated with additional operating burden, scenario combinations should be grounded in pilot observations rather than selected to produce a desired result.
Appendix F. Full Financial Model Workbook
Figure 1: Decision Dashboard
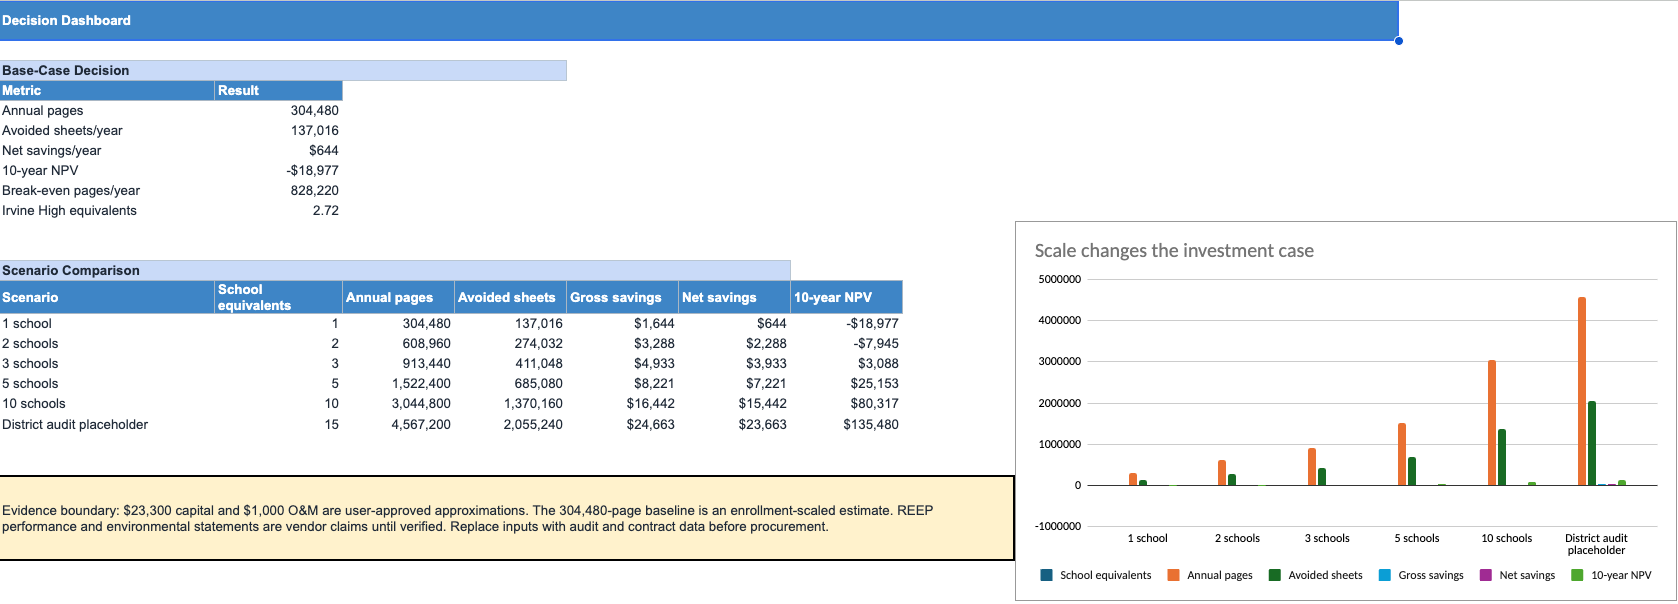
Figure 2: Model Inputs and Assumption Register
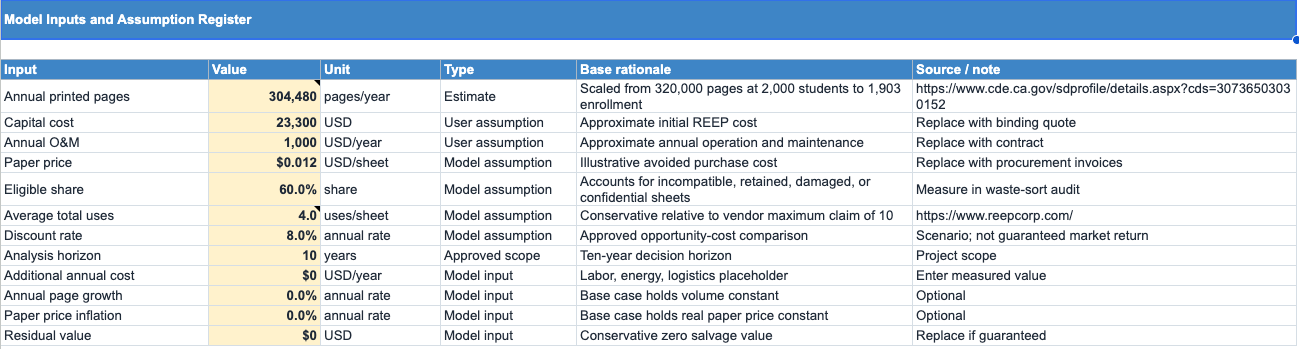
Figure 3: 10-Year Discounted Cash Flow
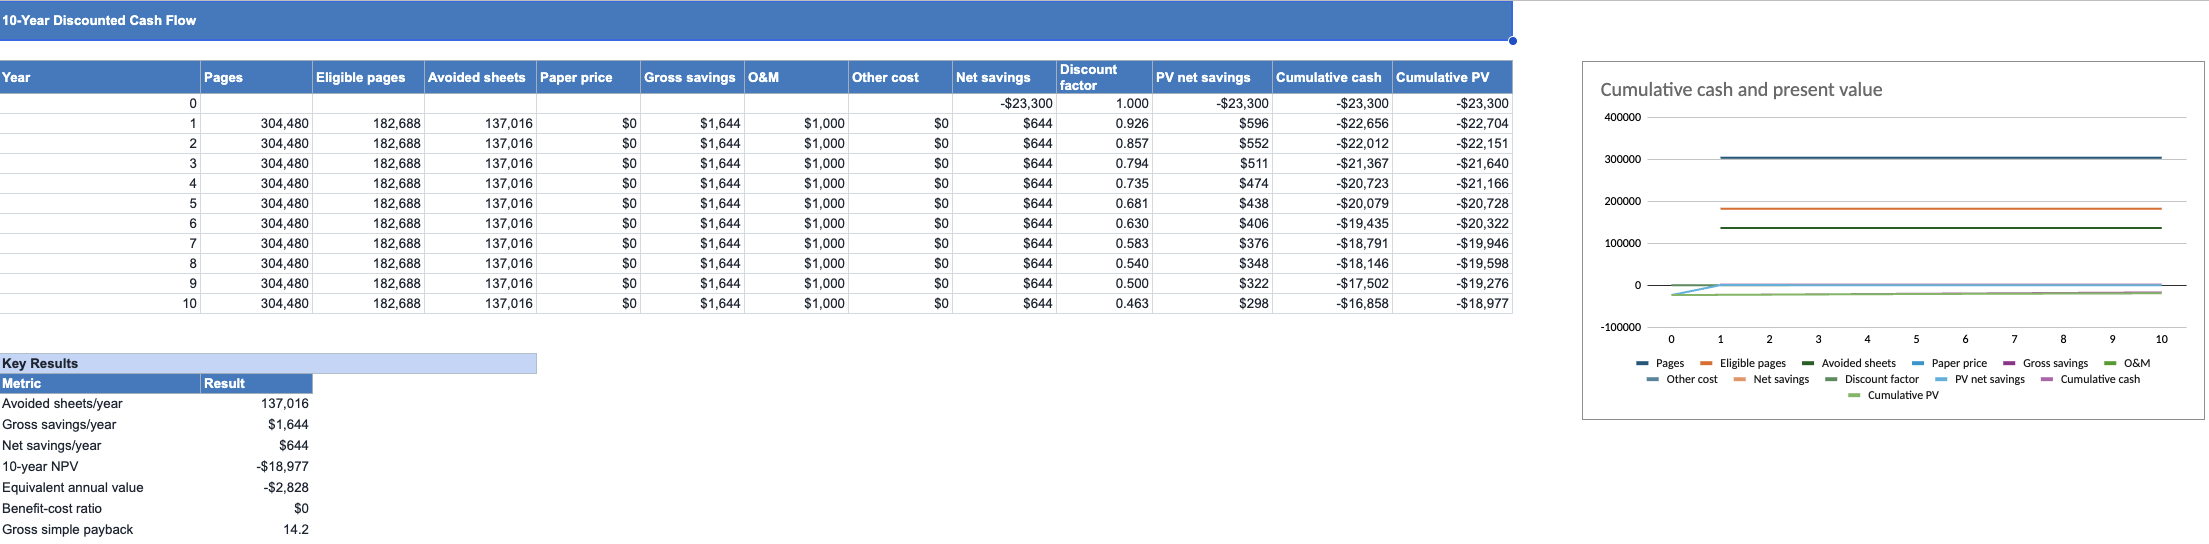
Figure 4: Single-School and Shared-Use Scenarios
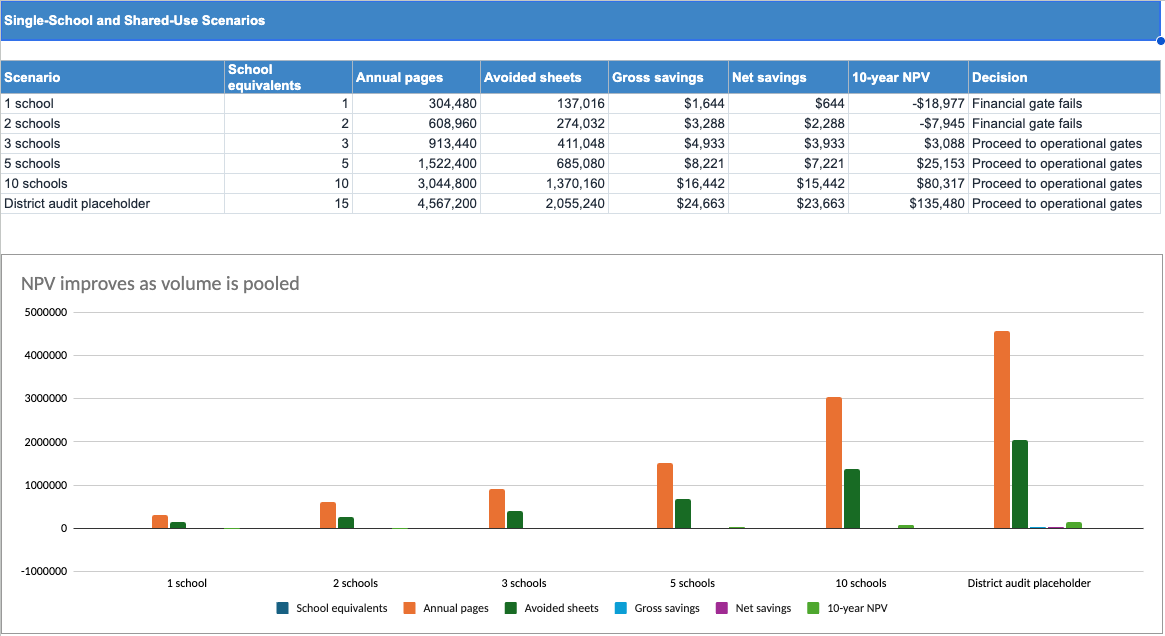
Figure 5: Break-even Calculator and Curve
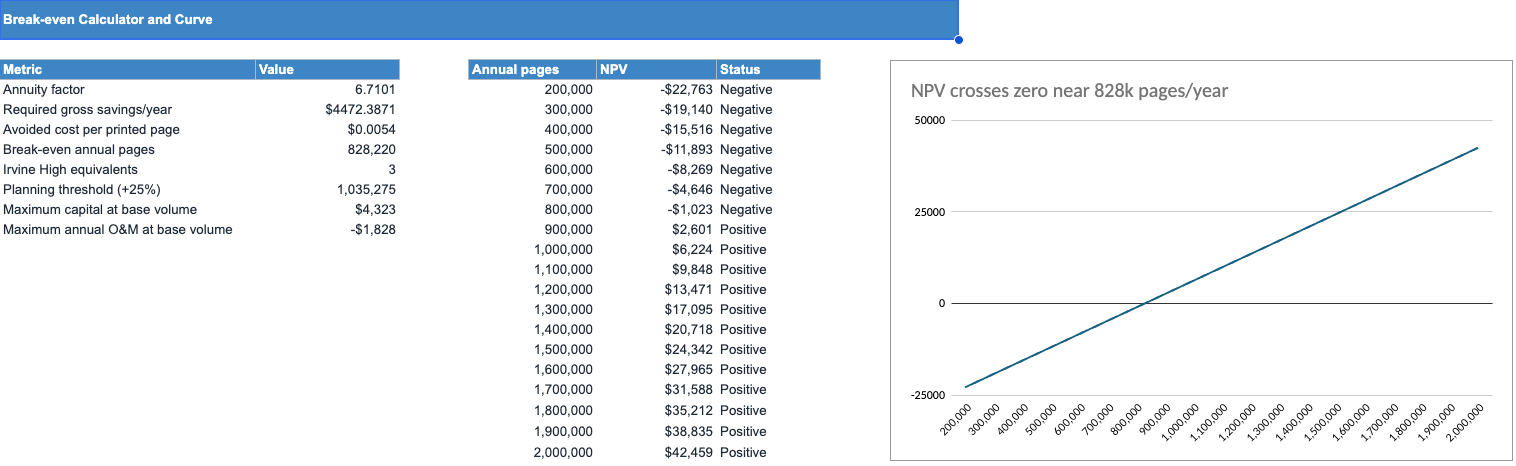
Figure 6: One-Way and Two-Way Sensitivity
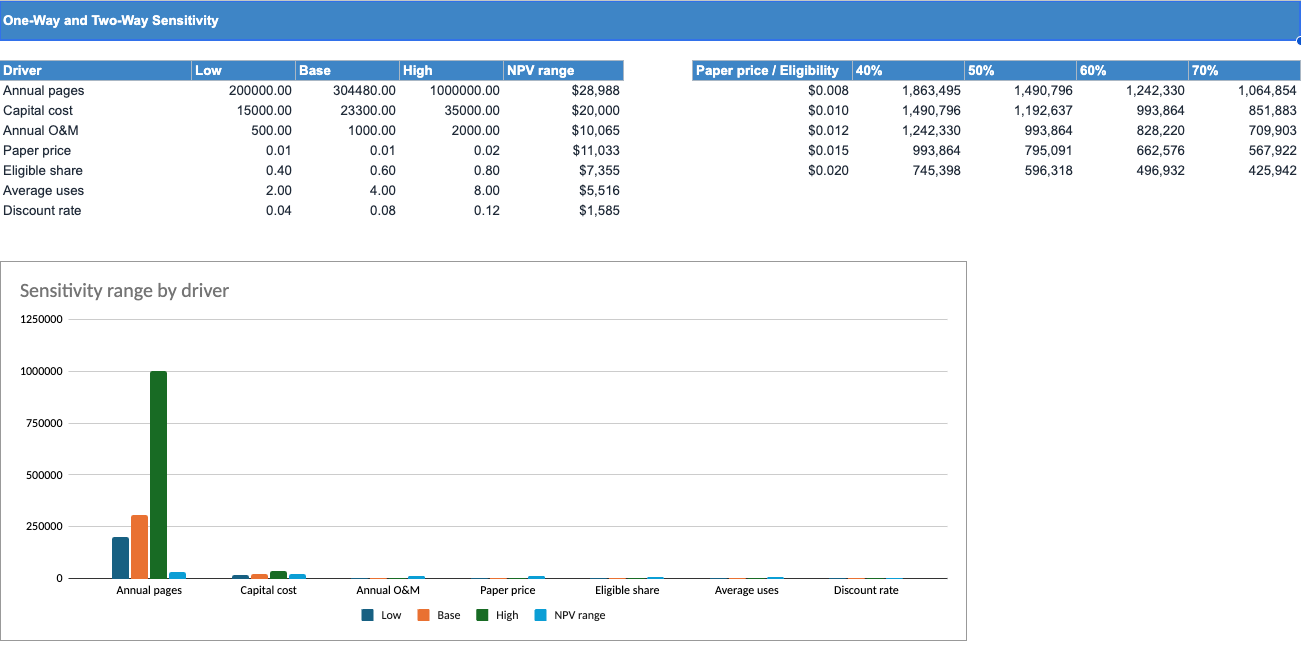
Figure 7: Monte Carlo Simulation

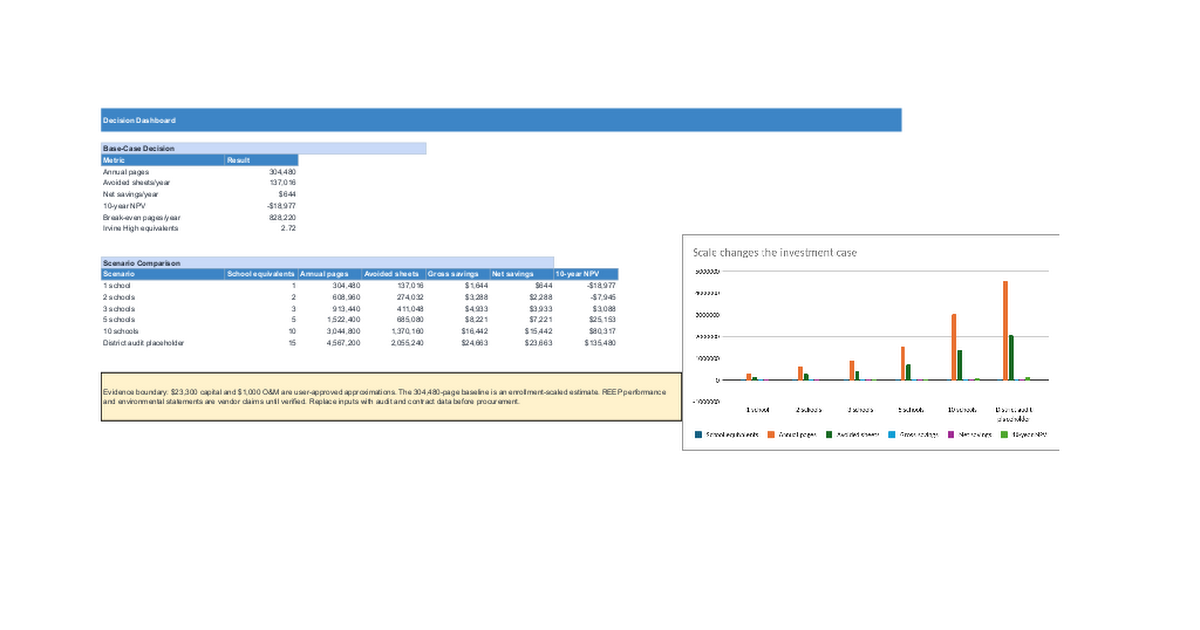
Figure 8: Environmental Scenario Indicators
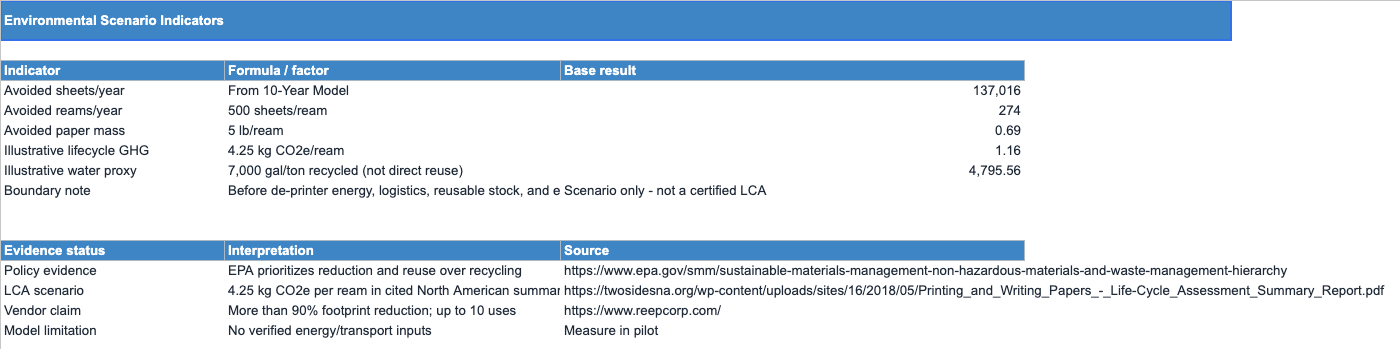
Figure 9: Procurement Decision Gates
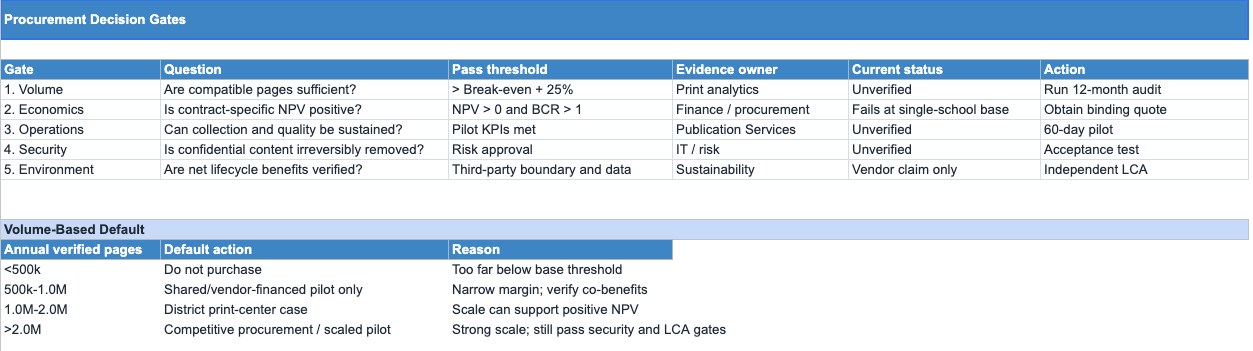
Figure 10: Source Register and Evidence Classification

